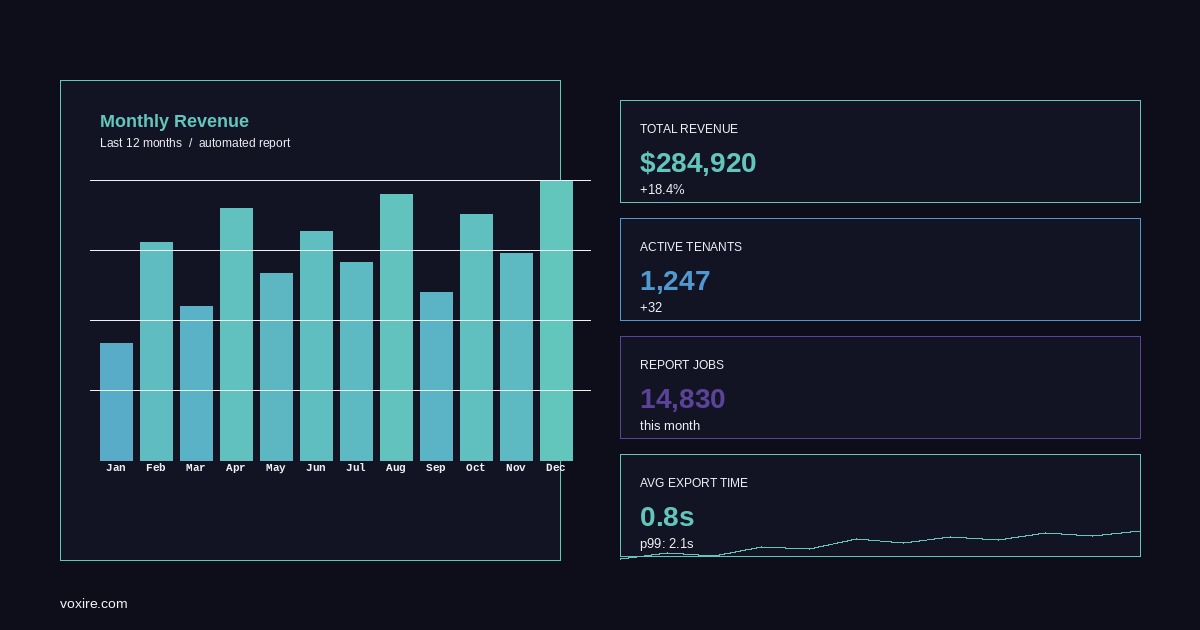
Most SaaS products in Lebanon and the Gulf ship with manual reporting first. Here is the architecture Voxire built for RTYLR to automate daily, weekly, and monthly reports across multi-tenant restaurant chain clients using Go and PostgreSQL.
The Problem With Manual Reporting at Scale
Most SaaS products in Lebanon and the Gulf market ship with manual reporting first. Someone exports a CSV, pastes it into a spreadsheet, formats the numbers, and sends it to the operations manager. This works at five locations. It stops working at fifteen.
The inflection point where manual reporting breaks is predictable: when a client has more than 50 locations, or when the operations team needs daily numbers before 8am. At that point, the manual process either degrades in quality, creates a dedicated reporting headcount, or both.
This is the situation Voxire encountered with RTYLR's restaurant chain clients. Chains running 20, 50, and eventually 100-plus locations needed consolidated daily sales reports, weekly trend summaries, and monthly P&L breakdowns in their inboxes before the opening shift. The answer was building automated report generation directly into the RTYLR platform.
What Breaks With Manual Reporting at Scale
The obvious problem is time. A 50-location chain produces enough transactional data that building a consolidated report manually takes two to three hours. But the less obvious problems are worse.
Data staleness. Manual reports get built at a point in time. If someone runs the numbers at 9am, anything that posted after closing the night before might be missing depending on how the export is timed. Automated reports built from database state at a defined cutoff are deterministic.
Inconsistency between reports. When multiple people produce reports, the filters, date ranges, and aggregation logic drift. One person includes voided orders in the total; another does not. Automated reports execute the same query every time.
No audit trail. When a manual report is wrong, tracing the error back to its source is painful. An automated system logs every run, every query, and every output artifact.
Designing the Report Job Table in PostgreSQL
The foundation of RTYLR's reporting system is a report_jobs table that controls scheduling and tracks execution state.
CREATE TABLE report_jobs (
    id           UUID PRIMARY KEY DEFAULT gen_random_uuid(),
    tenant_id    UUID NOT NULL REFERENCES tenants(id),
    report_type  TEXT NOT NULL,
    schedule     TEXT NOT NULL,
    timezone     TEXT NOT NULL DEFAULT 'Asia/Beirut',
    last_run_at  TIMESTAMPTZ,
    next_run_at  TIMESTAMPTZ NOT NULL,
    status       TEXT NOT NULL DEFAULT 'pending',
    recipients   JSONB NOT NULL DEFAULT '[]',
    config       JSONB NOT NULL DEFAULT '{}',
    created_at   TIMESTAMPTZ NOT NULL DEFAULT NOW(),
    updated_at   TIMESTAMPTZ NOT NULL DEFAULT NOW()
);

CREATE INDEX idx_report_jobs_tenant ON report_jobs(tenant_id);
CREATE INDEX idx_report_jobs_next_run ON report_jobs(next_run_at) WHERE status = 'pending';
The schedule field stores a cron expression. The timezone field matters significantly for MENA deployments: a restaurant chain in Riyadh operates on AST (+3), while a chain in Beirut operates on EET (+3 during winter, +3 during summer with a DST shift that does not always align with Gulf time). Storing timezone per job and doing all cutoff calculations in the application layer avoids a class of off-by-one errors that are genuinely hard to debug in production.
The config JSONB field holds report-specific parameters: which location IDs to include, which metrics to surface, output format preferences, date range offsets.
Writing Efficient Aggregation Queries in PostgreSQL
The core aggregation query for a daily sales report looks like this:
SELECT
    l.id AS location_id,
    l.name AS location_name,
    DATE_TRUNC('day', o.created_at AT TIME ZONE $1) AS report_date,
    COUNT(o.id) AS order_count,
    SUM(o.total_amount) AS gross_sales,
    SUM(o.discount_amount) AS total_discounts,
    SUM(o.net_amount) AS net_sales,
    AVG(o.net_amount) AS avg_order_value
FROM orders o
JOIN locations l ON l.id = o.location_id
WHERE
    l.tenant_id = $2
    AND o.status NOT IN ('voided', 'test')
    AND o.created_at >= $3
    AND o.created_at < $4
GROUP BY l.id, l.name, DATE_TRUNC('day', o.created_at AT TIME ZONE $1)
ORDER BY l.name, report_date;
The AT TIME ZONE conversion is done in the query so that DATE_TRUNC groups correctly by the tenant's local date, not UTC. This single detail fixes an entire class of midnight-boundary bugs where orders placed between UTC midnight and local midnight end up in the wrong reporting day.
For rolling metrics like week-over-week comparison, window functions are more efficient than running a second query:
SELECT
    location_id,
    location_name,
    report_week,
    weekly_net_sales,
    LAG(weekly_net_sales) OVER (
        PARTITION BY location_id ORDER BY report_week
    ) AS prev_week_sales
FROM weekly_sales_summary
WHERE tenant_id = $1
ORDER BY location_id, report_week;
The LAG window function avoids a self-join and keeps the query readable. For large tenants with hundreds of locations and years of history, partial indexes on (tenant_id, created_at) are essential. Query plans should be reviewed with EXPLAIN ANALYZE for any new aggregation added to the system.
Generating CSV and PDF Outputs in Go
Go's standard library encoding/csv handles CSV generation cleanly. The pattern used in RTYLR is a thin report renderer that takes a query result and a list of column definitions:
type ReportColumn struct {
    Header    string
    Field     string
    Formatter func(v interface{}) string
}

func WriteCSV(w io.Writer, rows []map[string]interface{}, columns []ReportColumn) error {
    cw := csv.NewWriter(w)
    headers := make([]string, len(columns))
    for i, col := range columns {
        headers[i] = col.Header
    }
    if err := cw.Write(headers); err != nil {
        return err
    }
    for _, row := range rows {
        record := make([]string, len(columns))
        for i, col := range columns {
            val := row[col.Field]
            if col.Formatter != nil {
                record[i] = col.Formatter(val)
            } else {
                record[i] = fmt.Sprintf("%v", val)
            }
        }
        if err := cw.Write(record); err != nil {
            return err
        }
    }
    cw.Flush()
    return cw.Error()
}
For PDF generation, RTYLR uses a two-step process: render an HTML template with Go's html/template, then convert to PDF via a headless browser command. Libraries like gofpdf work for simple tabular reports but struggle with Arabic text and right-to-left layout, which is a real requirement for clients whose staff reads Arabic. The HTML-to-PDF path, while slower, produces the expected RTL layout without fighting the rendering engine.
Scheduling Report Delivery
The scheduler is a Go goroutine that polls report_jobs for jobs where next_run_at <= NOW() AND status = 'pending'. PostgreSQL advisory locks prevent two instances from picking up the same job during a deploy or horizontal scaling event:
func (s *Scheduler) acquireJobLock(ctx context.Context, jobID uuid.UUID) (bool, error) {
    var acquired bool
    err := s.db.QueryRowContext(ctx,
        "SELECT pg_try_advisory_xact_lock($1)",
        jobID.ID(), // numeric representation
    ).Scan(&acquired)
    return acquired, err
}
The advisory lock is transaction-scoped, so it is automatically released when the transaction completes. The scheduler marks the job running, executes the report, uploads the output to object storage, updates last_run_at and next_run_at, and marks the job completed or failed. A failed job is retried with a backoff: the next_run_at is set to NOW() + interval '15 minutes' for the first failure, NOW() + interval '1 hour' for the second, and so on up to a maximum retry count.
Multi-Tenant Report Isolation
Every query in the reporting system includes tenant_id in the WHERE clause. This is enforced at the repository layer, not the handler layer. The repository function signature requires a tenantID uuid.UUID parameter and there is no code path that queries the orders or locations tables without it.
As a secondary safety net, RTYLR's PostgreSQL roles use row-level security:
ALTER TABLE orders ENABLE ROW LEVEL SECURITY;

CREATE POLICY tenant_isolation ON orders
    USING (tenant_id = current_setting('app.current_tenant')::uuid);
The application sets SET LOCAL app.current_tenant = $tenant_id at the start of each transaction. If a query somehow escapes the application-level tenant filter, RLS blocks it at the database level. The defense-in-depth approach has caught two application bugs in production that would otherwise have resulted in cross-tenant data exposure.
Email Delivery With Retry
Generated reports are sent as email attachments. RTYLR uses Mailgun for transactional email. The Go client wraps the send call with exponential backoff:
func (m *MailgunSender) SendReport(ctx context.Context, to []string, subject string, attachment []byte, filename string) error {
    backoff := 1 * time.Second
    for attempt := 0; attempt < 3; attempt++ {
        err := m.send(ctx, to, subject, attachment, filename)
        if err == nil {
            return nil
        }
        if !isRetryable(err) {
            return err
        }
        select {
        case <-ctx.Done():
            return ctx.Err()
        case <-time.After(backoff):
            backoff *= 2
        }
    }
    return ErrMaxRetriesExceeded
}
isRetryable returns true for transient network errors and HTTP 429/5xx responses from the Mailgun API, and false for 4xx errors that indicate a permanent failure (bad address, template error).
Key Lessons From Production
Building this system for RTYLR across Lebanese and Gulf restaurant chains surfaced several lessons that are worth documenting.
Timezone handling is a first-class concern. Do not defer it. Build it into the schema and query layer from the start. MENA deployments span at least three different UTC offsets and DST rules that diverge from European conventions.
Query performance degrades non-linearly at scale. A query that runs in 200ms for a tenant with 10 locations runs in 8 seconds for a tenant with 200 locations if the indexes are wrong. Instrument aggregation query times per tenant from day one.
Clients always want a new metric. The column definition pattern for CSV/PDF output pays for itself quickly. Adding a new column is a configuration change, not a code change.
Failed reports need operator visibility. A job that fails silently is worse than a job that was never built. RTYLR's internal dashboard shows failed report jobs in real time and paging alerts fire when the failure rate for a tenant exceeds two consecutive runs.
Not sure where to start? If your SaaS product is still generating reports manually or you need help building an automated reporting layer that scales with your tenant base, the Voxire engineering team can scope and build it. Start the conversation at https://voxire.com/get-a-quote/
Enjoying this article?
Enter your email and get a clean, formatted PDF of this article: free, no spam.
Voxire
SaaS Products
Building and running SaaS: Go and PostgreSQL, distributed systems, multi-tenancy, billing, observability, and the production engineering behind RTYLR. Written from shipping our own product, not from reading about it.
Learn more